7. Execution details
| Sito: | LifeWatch Italy Training Platform |
| Corso: | DataLabs - Tutorial Services |
| Libro: | 7. Execution details |
| Stampato da: | Guest user |
| Data: | martedì, 3 novembre 2026, 00:55 |
To access the Execution details section, you need to:
1. click on the appropriate service record within the List of Services
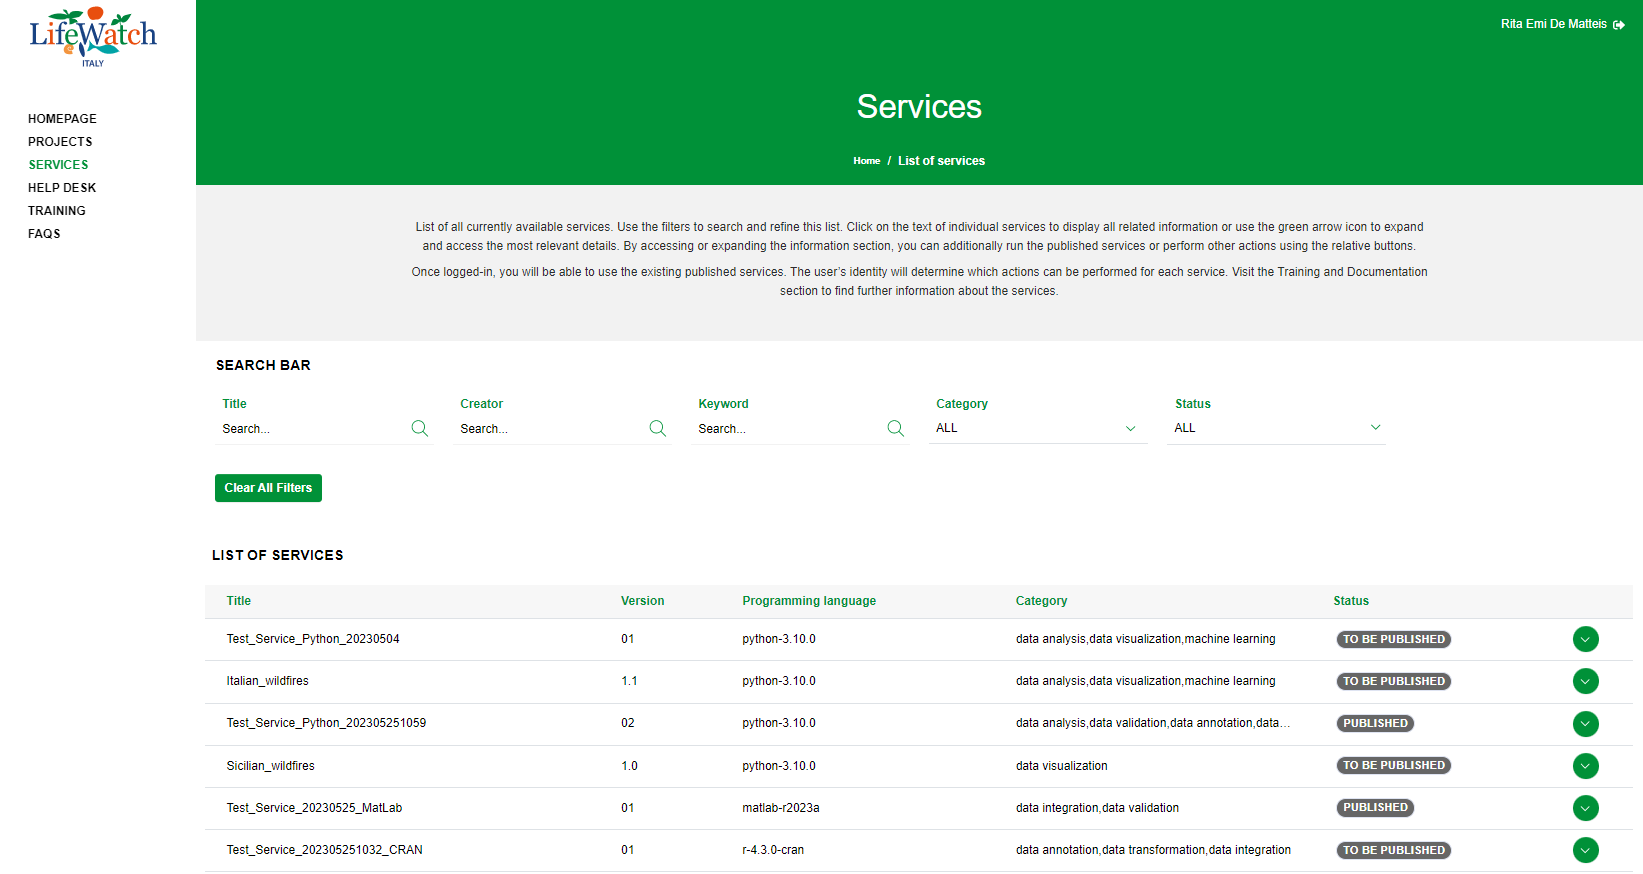
2. click on the Collapse icon to open the Execution accordion and click on the appropriate execution record
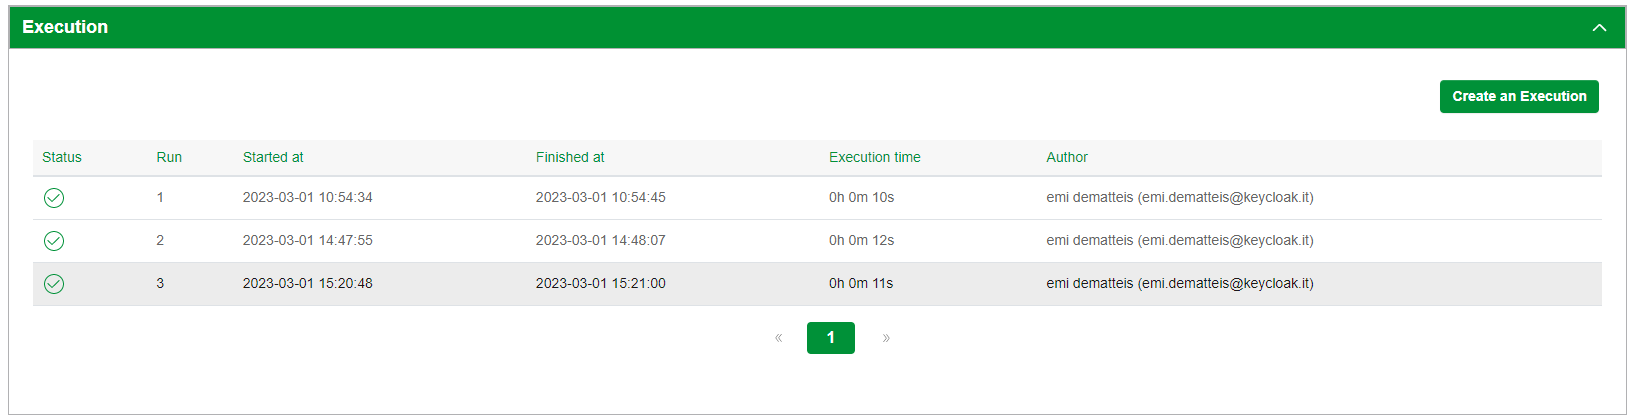
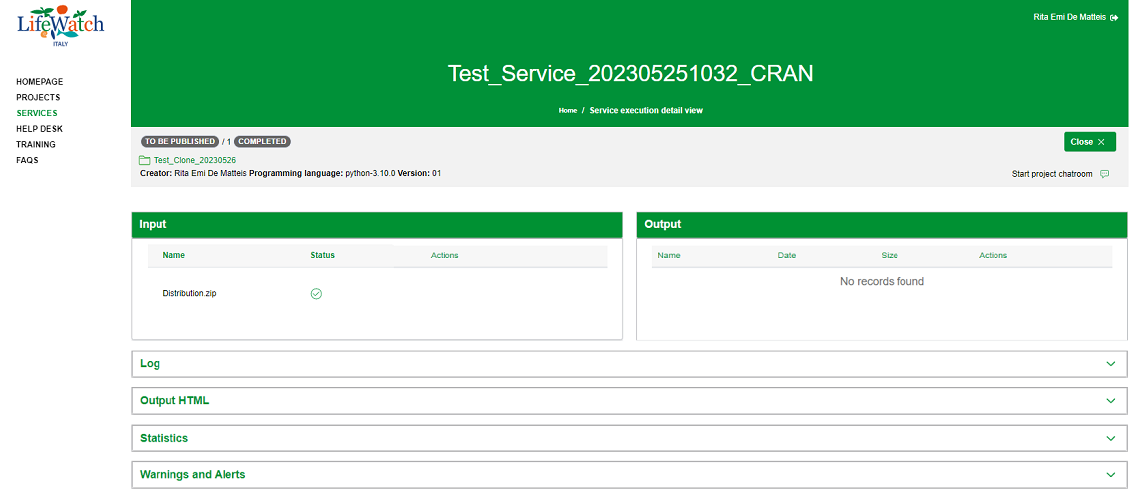
The page is organized into two main areas, Header and Content.
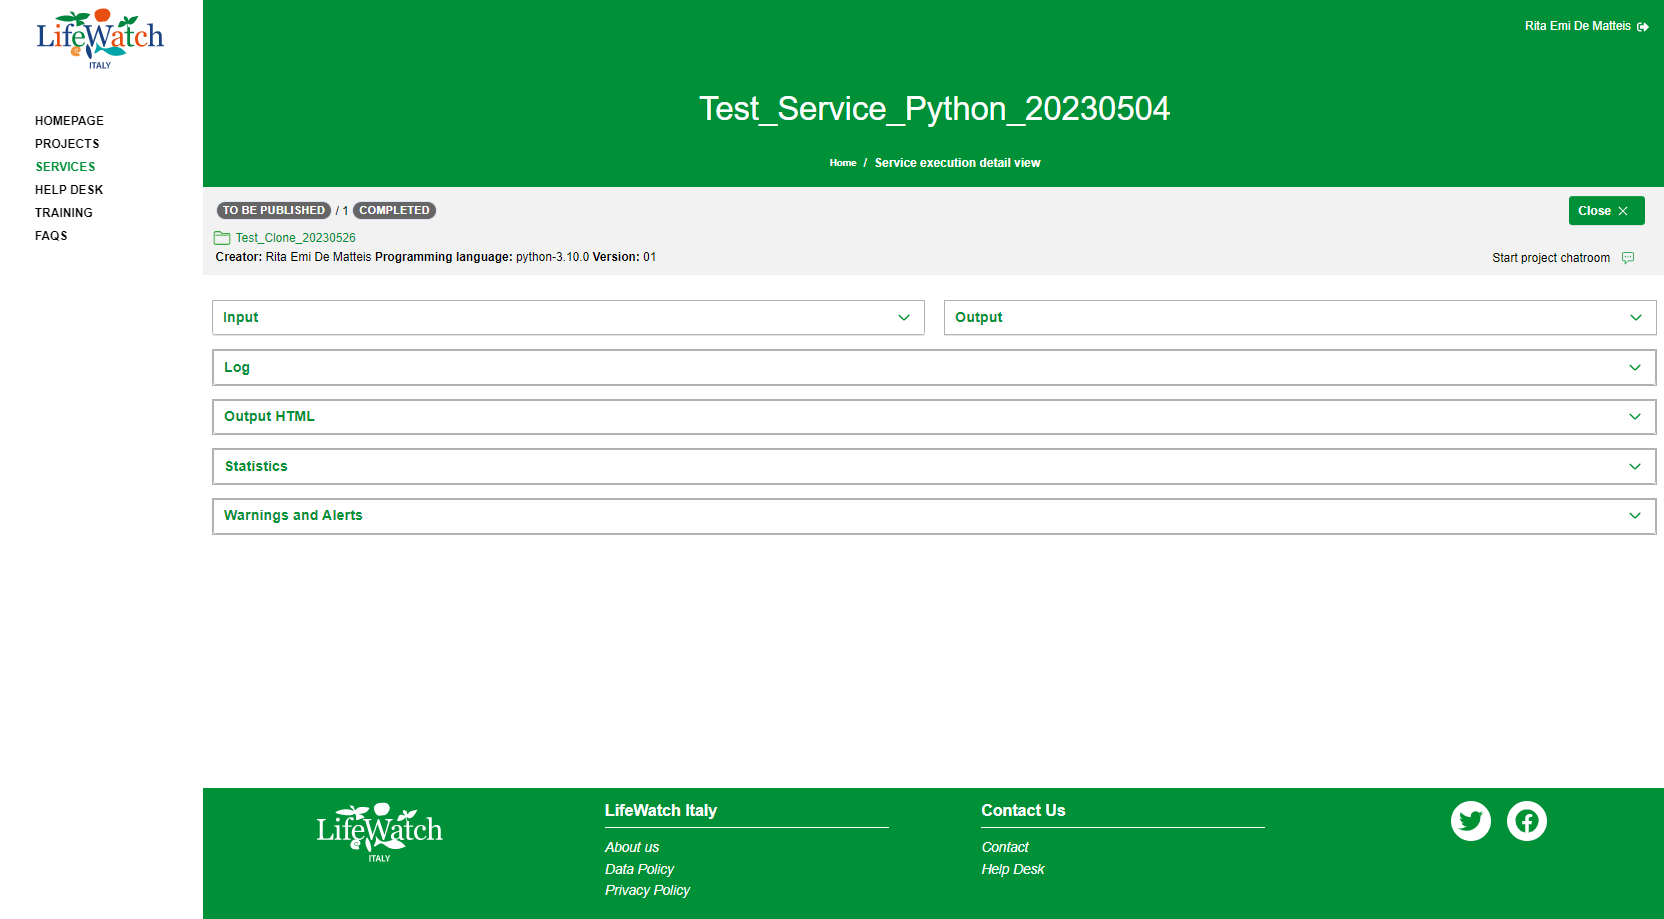
About to the Header, the data are arranged into two different bars:
- Logout button
- Username
- Project Information bar
while the Content contains the following information:
- Input
- Output
- Log
- Output HTML
- Statistics
- Warnings and Alerts
All details are described in the next paragraphs.
7.1 Execution information bar
The execution information bar is always visible in all pages relating to the service and contains the following data:
- the name of the service
- the breadcrumb
- the status of the service
- the execution ID
- the status of execution
- the reference of the related project
- the name of the user who created the service
- the programming language
- the version of the service
- the button to close the execution detail page
- the access to the chat service associated to the project linked to the service

7.2 Input
To view this section, you need to:
1. click on the appropriate service record within the List of Services
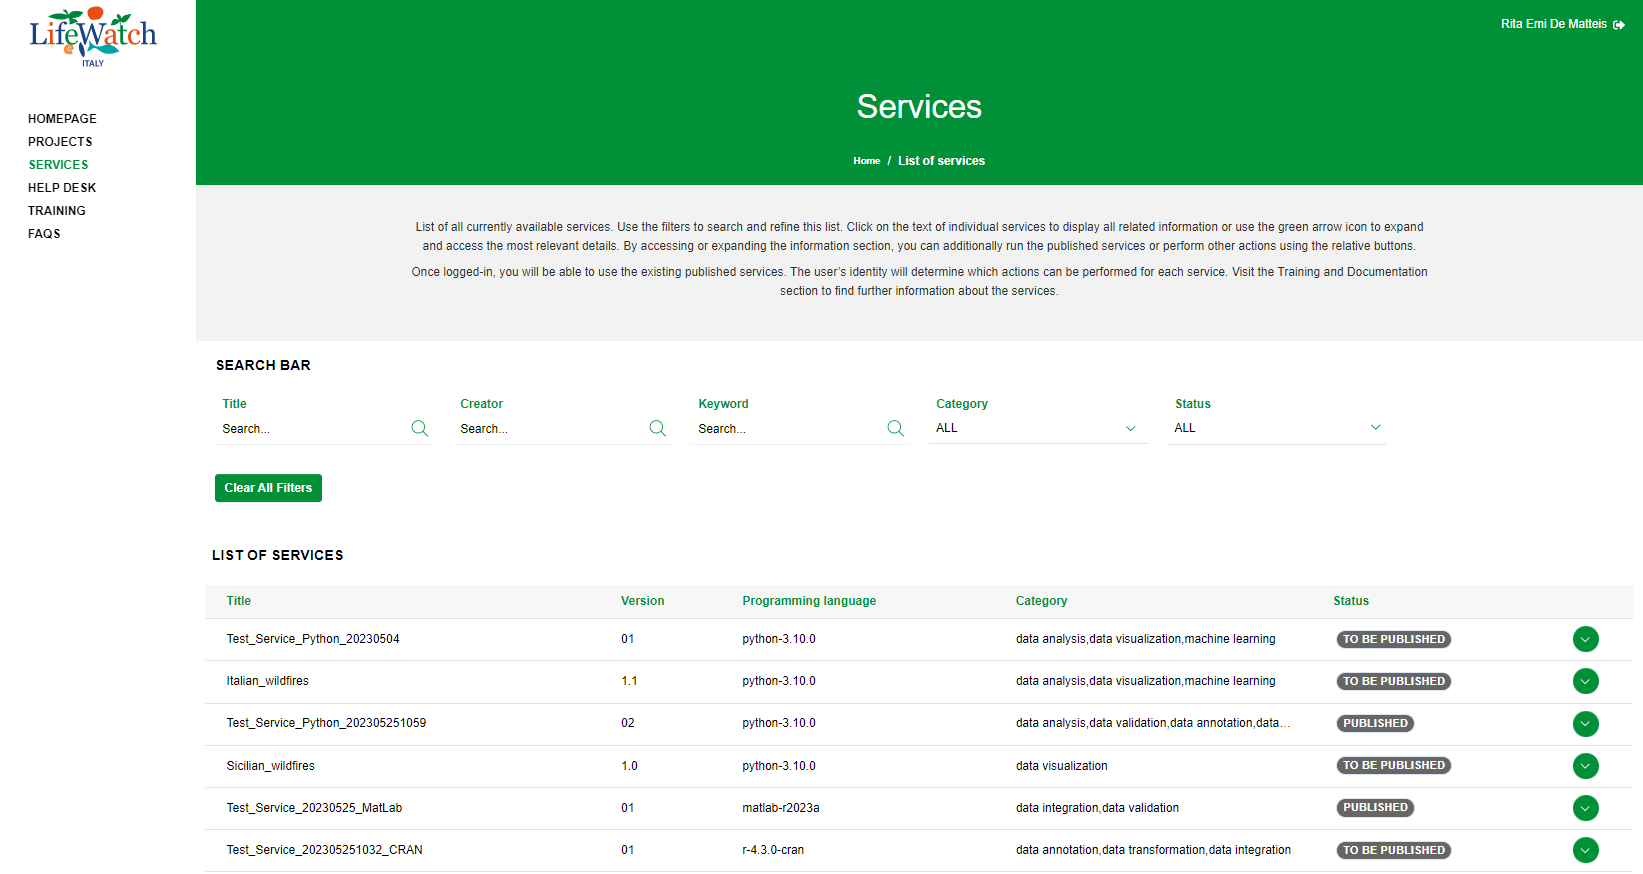
2. click on the Collapse icon to open the Execution accordion and click on the appropriate execution record
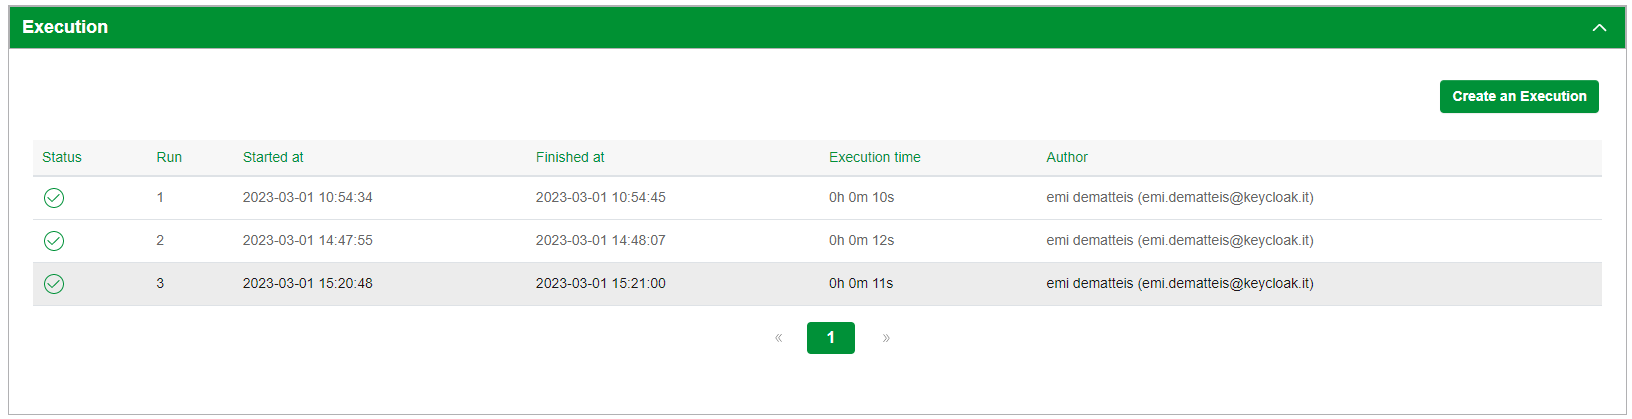
3. click on the Input accordion to see the information
7.2 Input
The section shows the name of the input file(s) assigned in the related project and any actions available depending on the execution status. In particular, if the execution is:
- in Wait status the system allows you to upload an input file for each slot provided. Please note that:
- the slots show the input file names associated with the related project
- the input file names can not be changed
- the execution can not be launched if all the expected input files have not been uploaded
For further details, please refer to "Launch a service execution" paragraph.
- in Running and Completed status the system does not allow you to perform any action.
7.3 Output
To view this section, you need to:
1. click on the appropriate service record within the List of Services
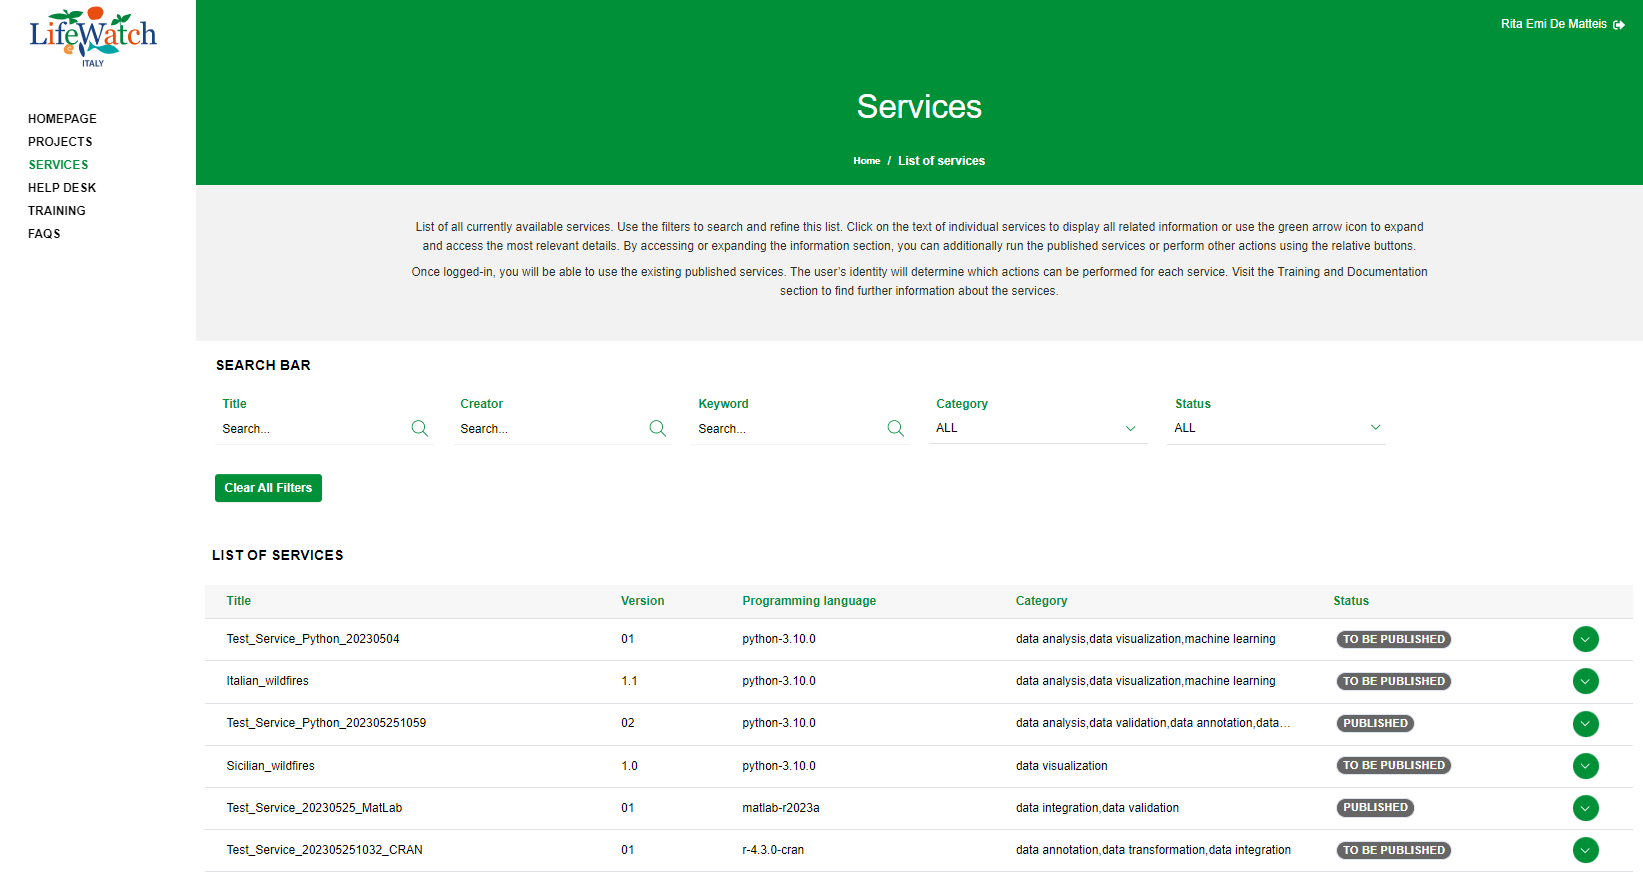
2. click on the Collapse icon to open the Execution accordion and click on the appropriate execution record
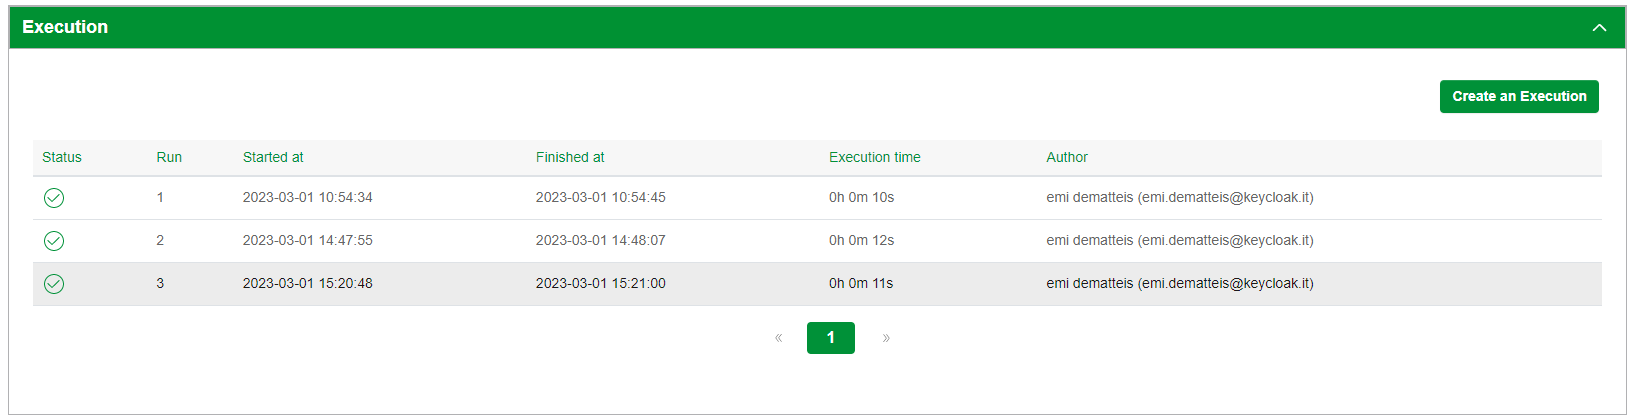
3. click on the Output accordion to see the information
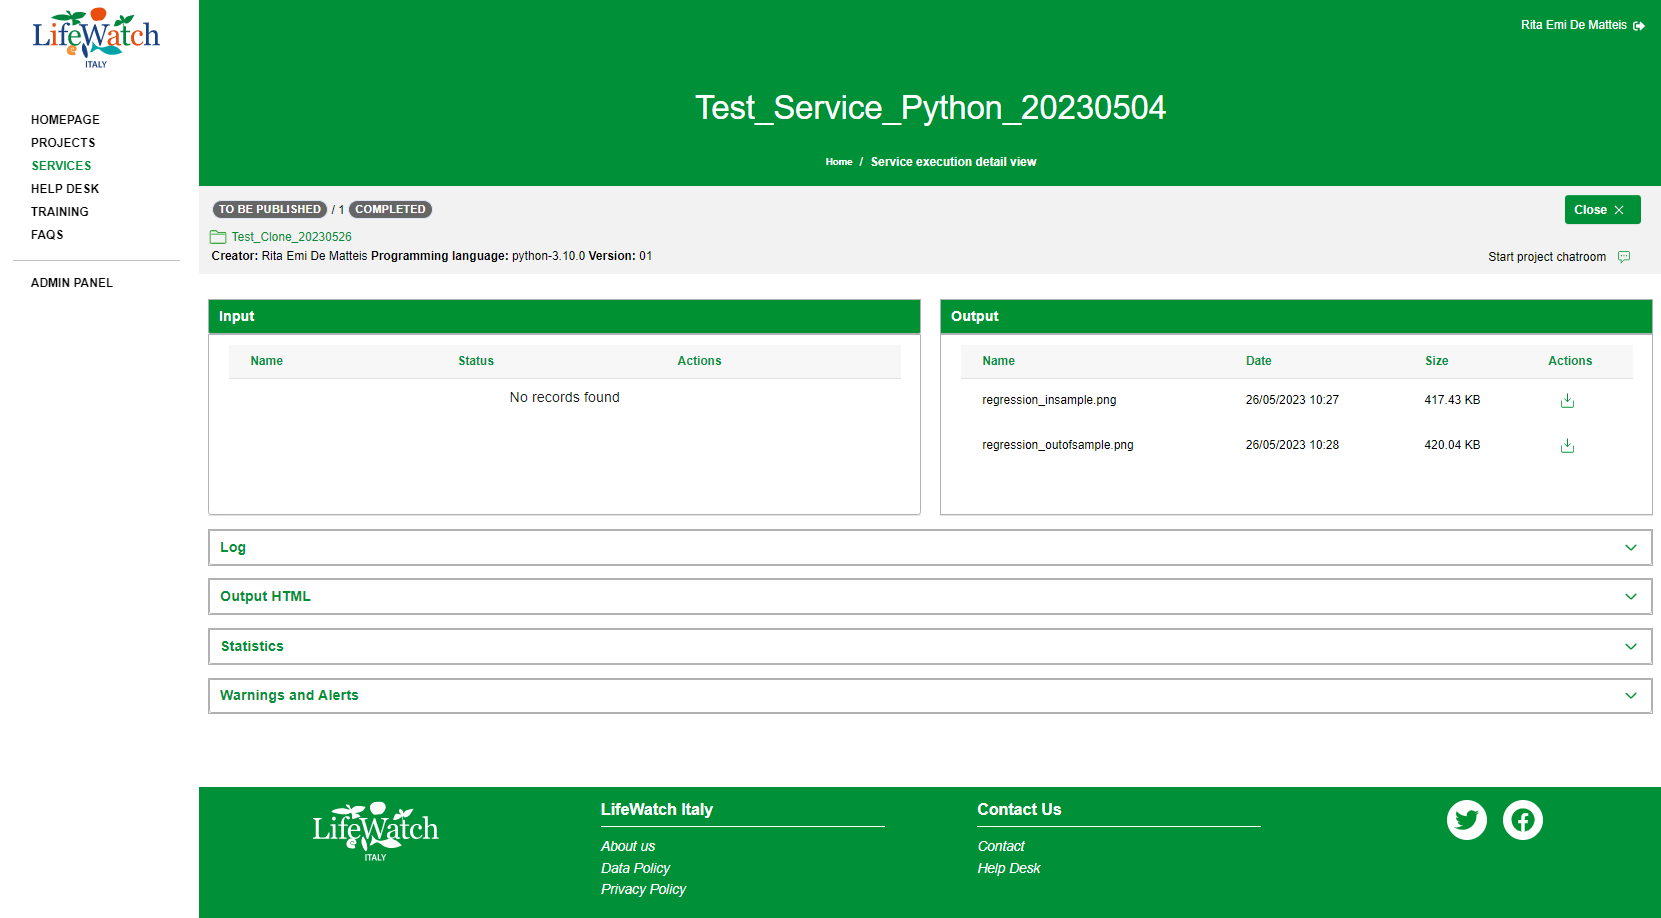
This section shows a set of information, that are:
- Name: field that contains the name of the output file
- Date: field that contains the date and time of output file creation
- Size: field that contains the size of output file created
- Actions: field that contains the download button
7.4 Log
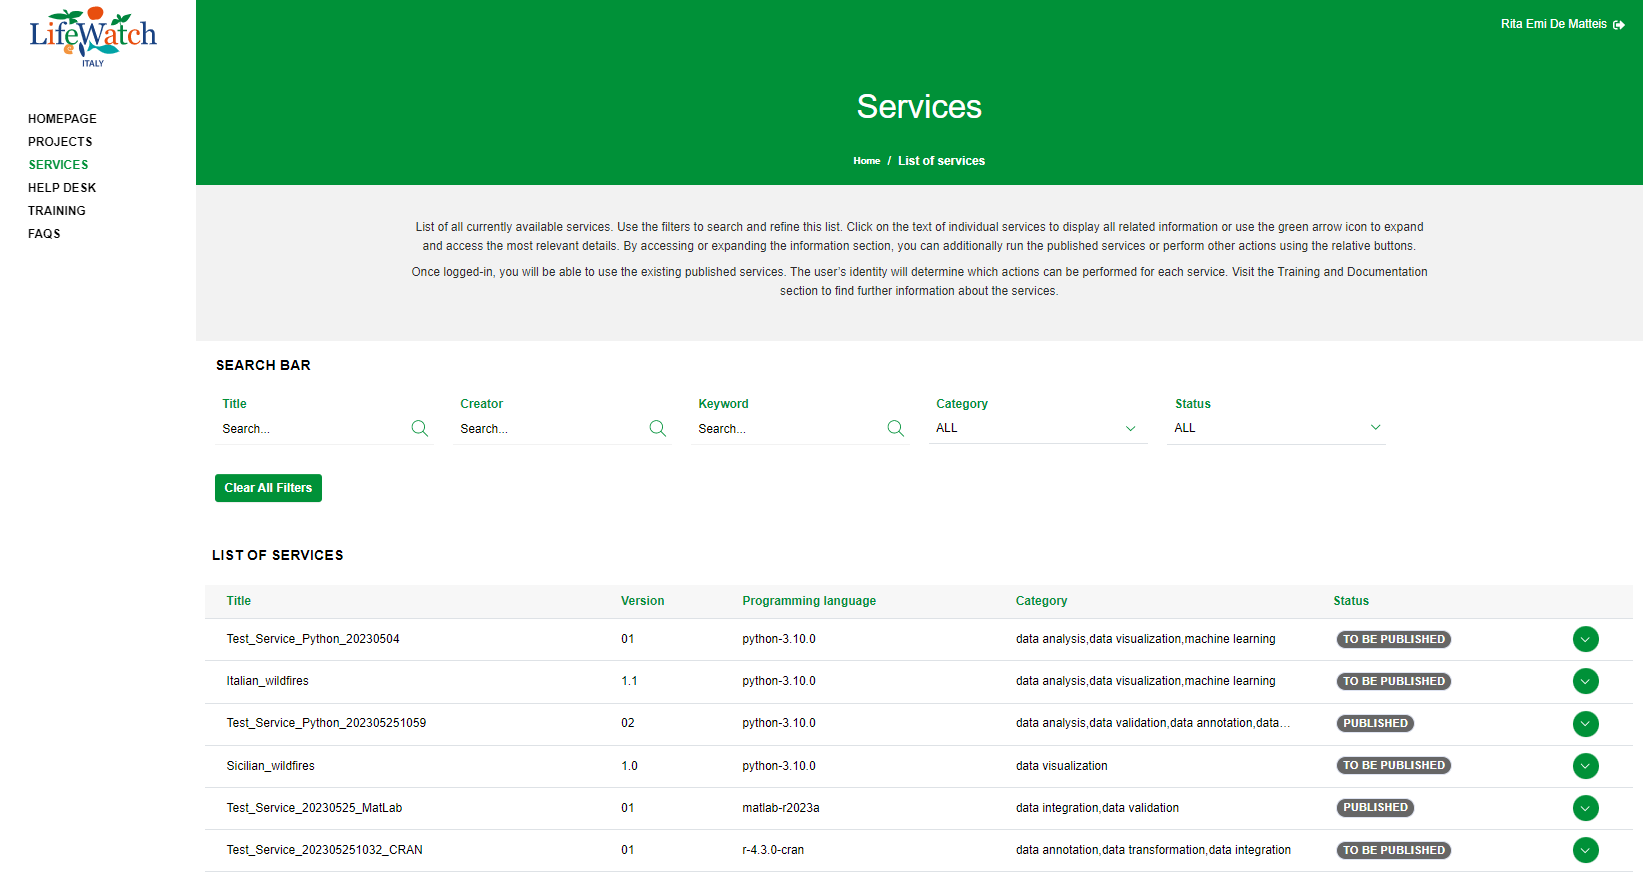
1. click on the appropriate service record within the List of Services
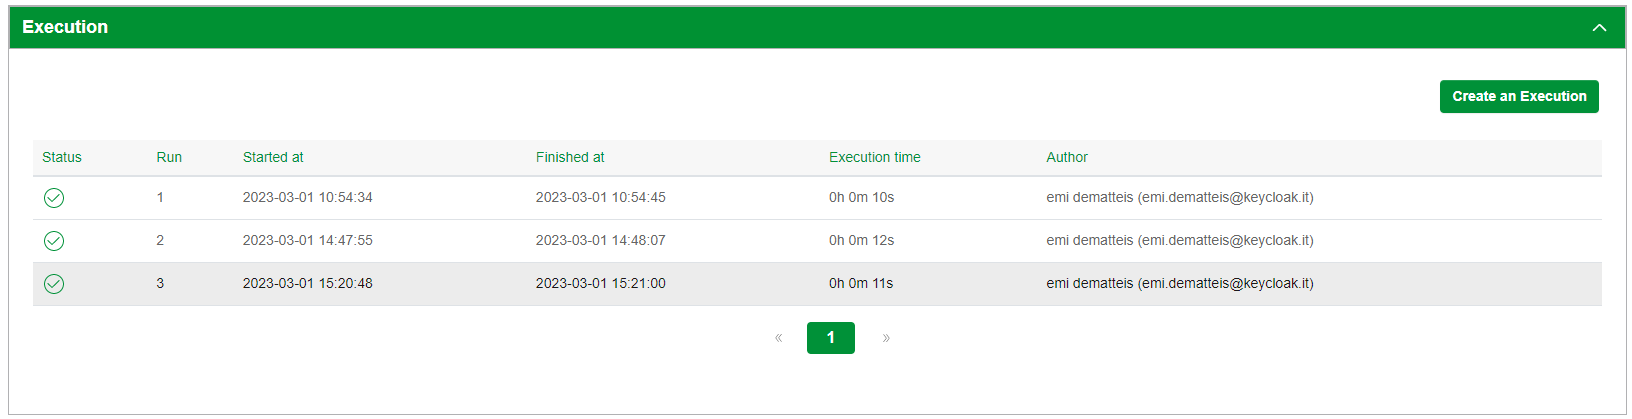
2. click on the Collapse icon to open the Execution accordion and click on the appropriate execution record
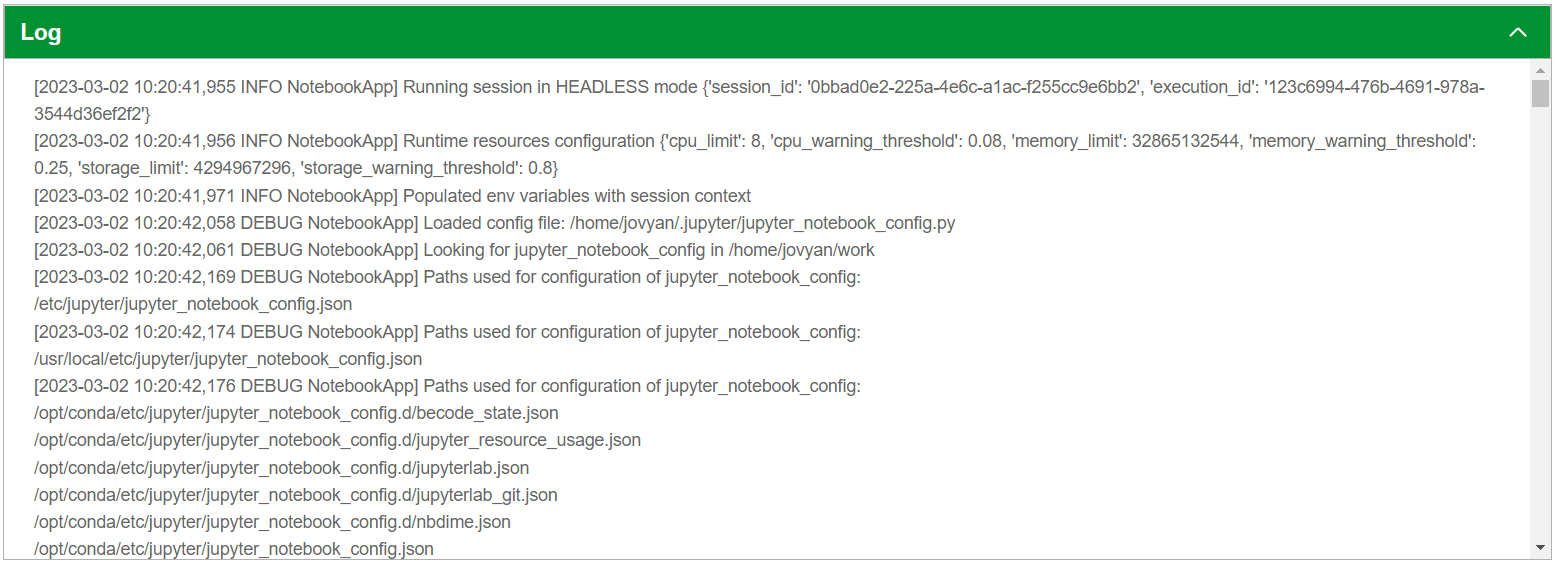
3. click on the Log accordion to see the information
7.5 Output HTML
To view this section, you need to:
1. click on the appropriate service record within the List of Services
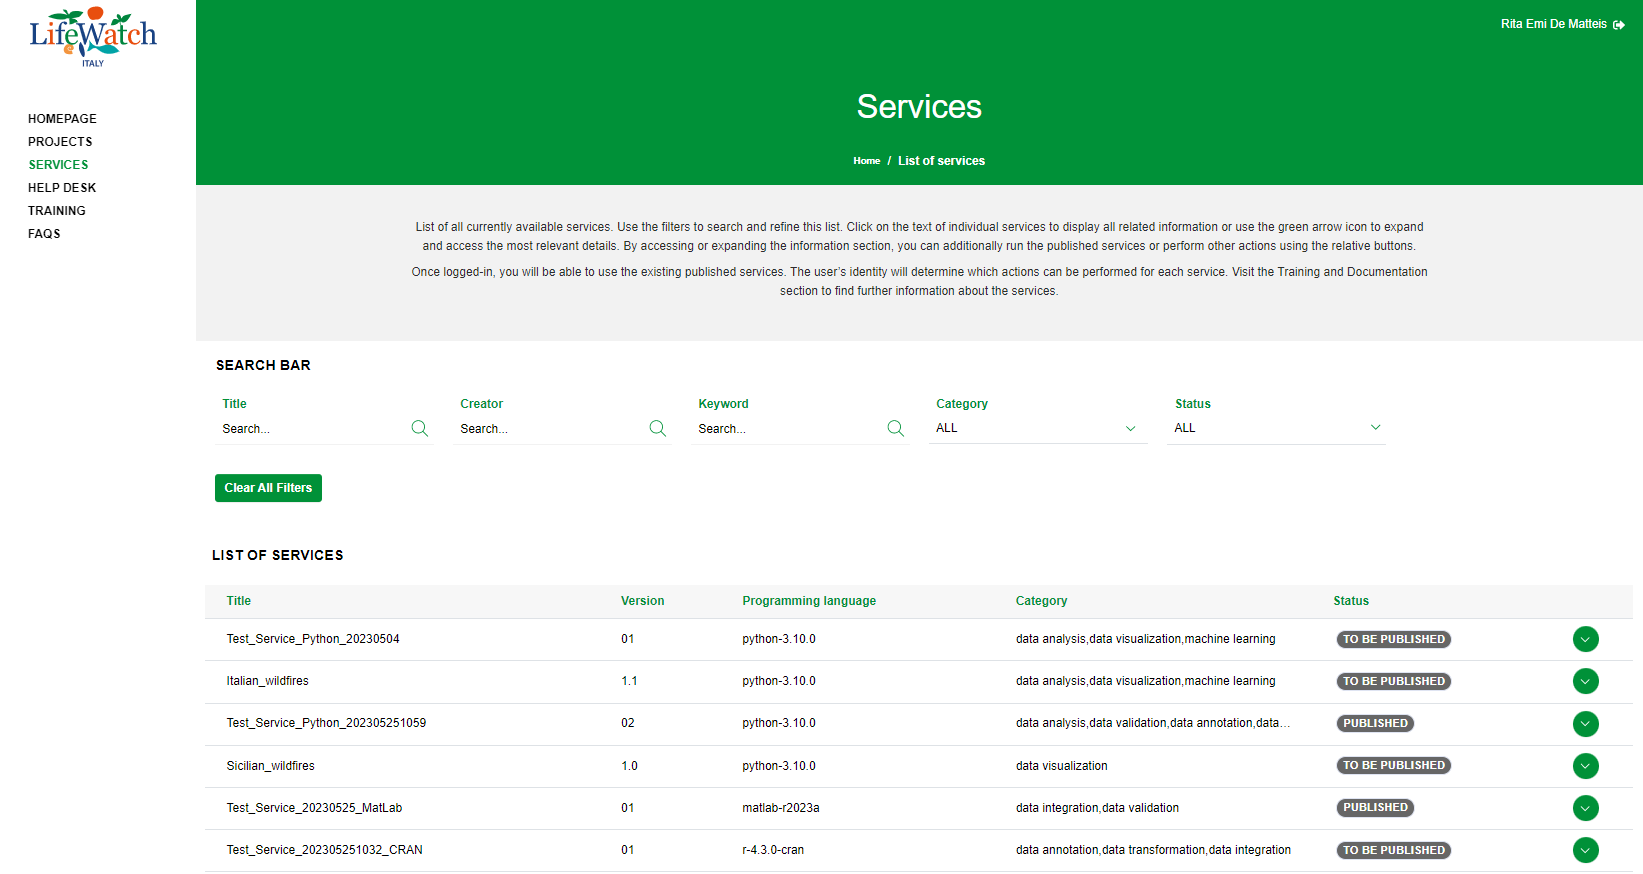
2. click on the Collapse icon to open the Execution accordion and click on the appropriate execution record
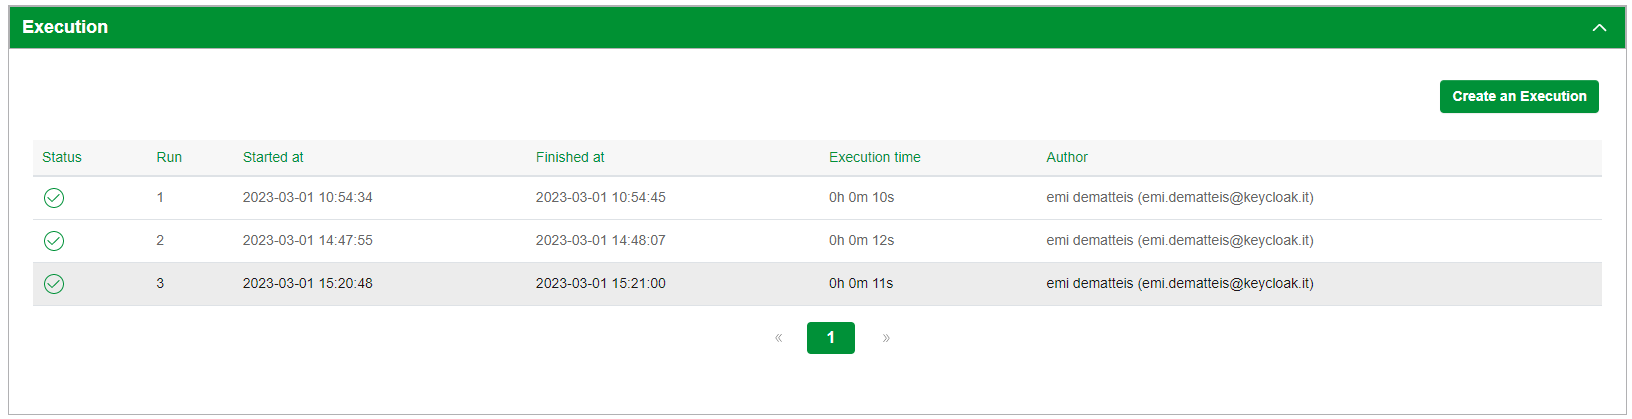
3. click on the Output HTML accordion to see the information
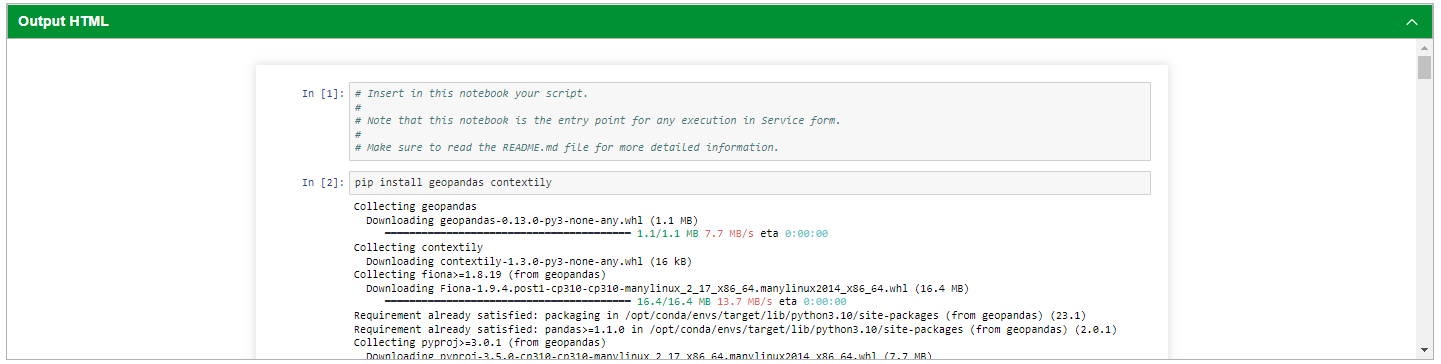
7.6 Statistics
To view this section, you need to:
1. click on the appropriate service record within the List of Services
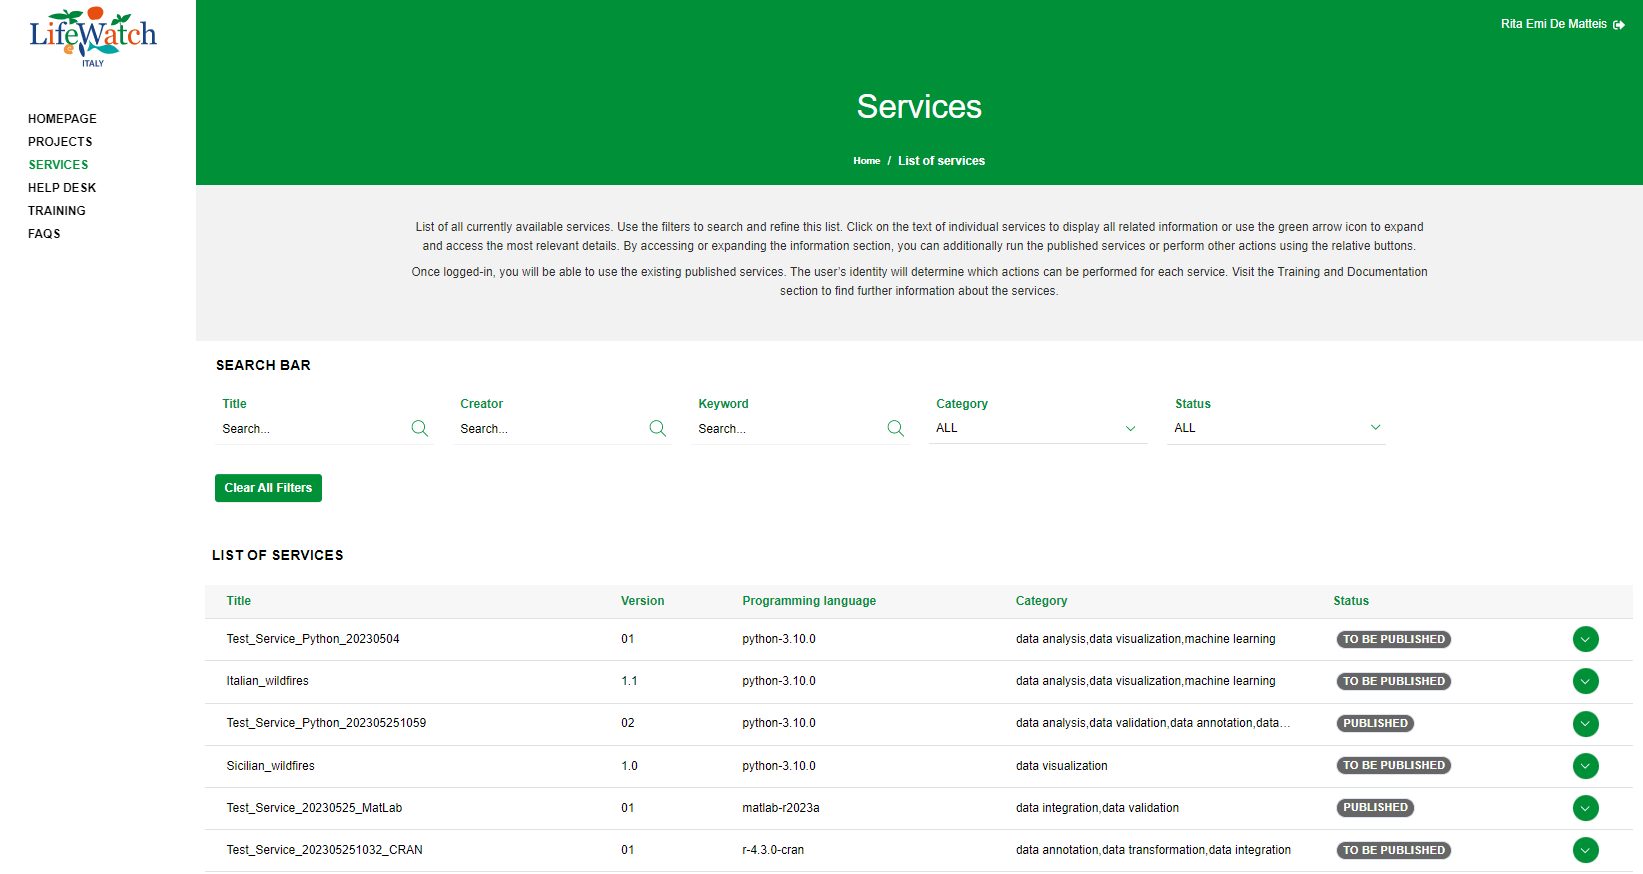
2. click on the Collapse icon to open the Execution accordion and click on the appropriate execution record
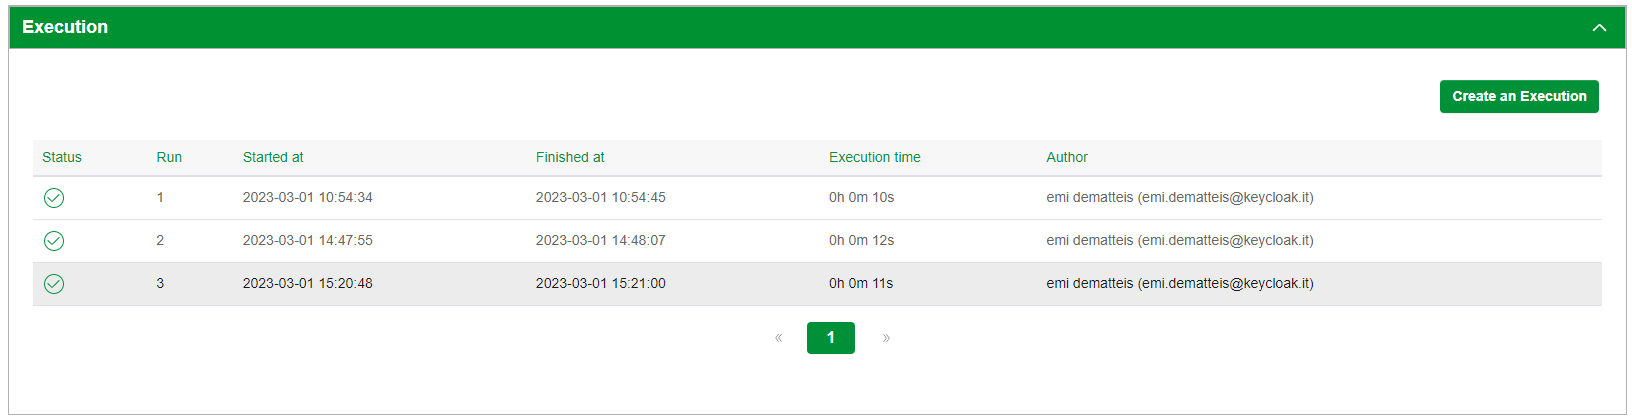
3. click on the Statistics accordion to see the information
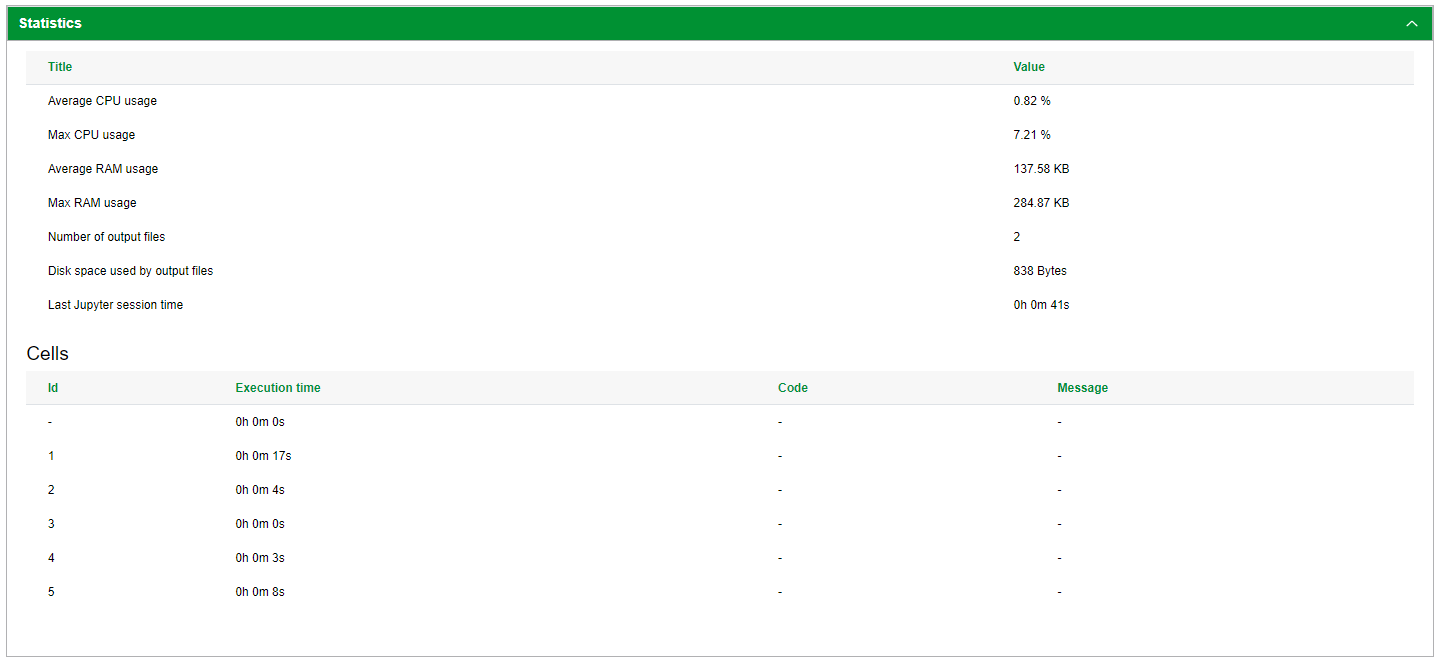
This section consists of two table:
- the first contains the statistics of the execution, that are:
- Average CPU usage
- Max CPU usage
- Average RAM usage
- Max RAM usage
- Number of output file
- Disk space used by output files
- Last Jupyter session time
- the second contains the execution time of each executed cell with any error messages.
7.7 Warning and Alerts
To view this section, you need to:
1. click on the appropriate service record within the List of Services
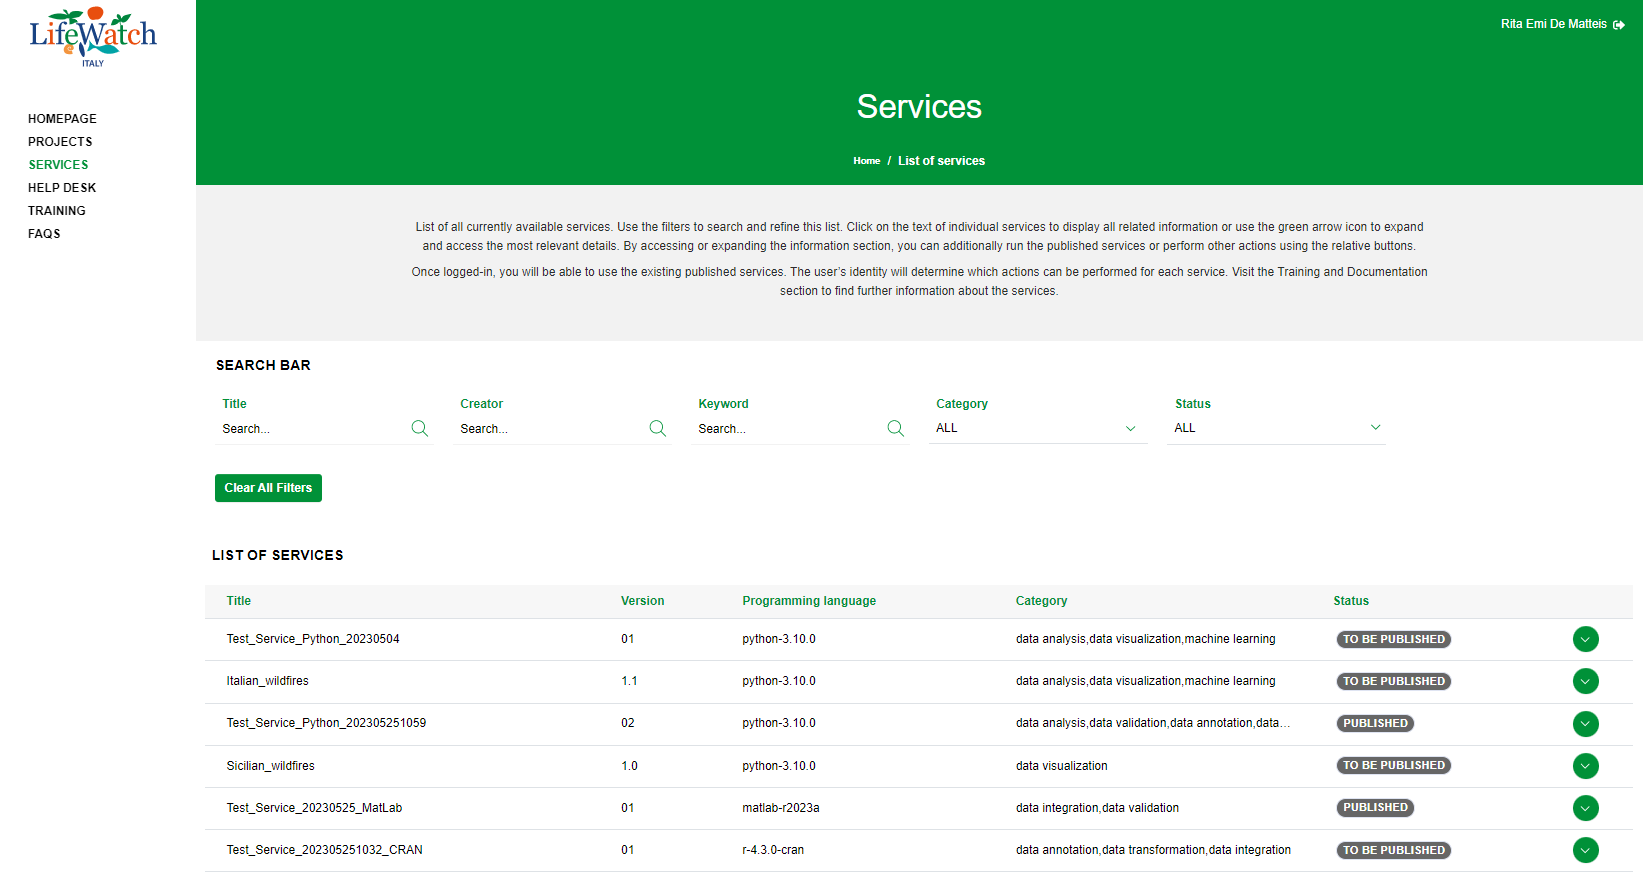
2. click on the Collapse icon to open the Execution accordion and click on the appropriate execution record
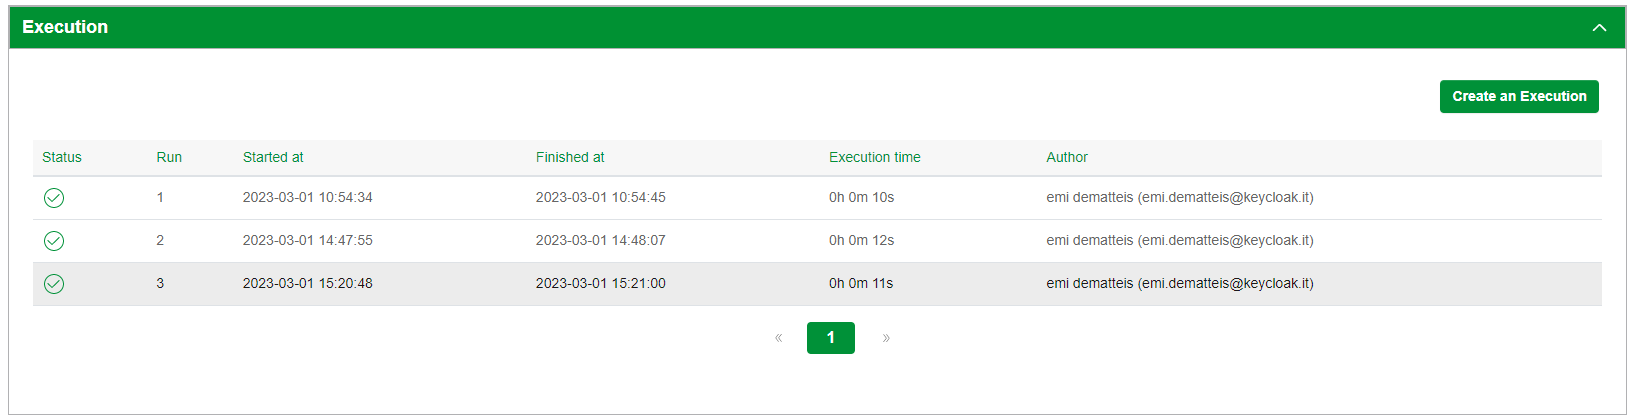
3. click on the Warning and Alerts accordion to see the information
