1. Custom JupyterLab environment
Aggregazione dei criteri
1.6 Resources monitoring
Information related to resources usage are:
- Current and recent CPU usage (%)
- Current and recent Memory usage (MB)
- the execution time of each notebook cell (see details in the paragraph 2.5.3).
On the top bar in the JupyterLab notebook there are graphs related to system resources usage:
- CPU
- RAM
Click on graph to
change visualization type (bar/spyke).

Figure 8 – Resources monitoring – example of spyke graph

Figure 9 – Resource monitoring – example of bar graph
Warning messages
If a warning resource threshold is exceeded, system provides an alert showing, in the notebook bottom right, a warning message specific for resource type. Please note that warning resources thresholds are configured by system administrator.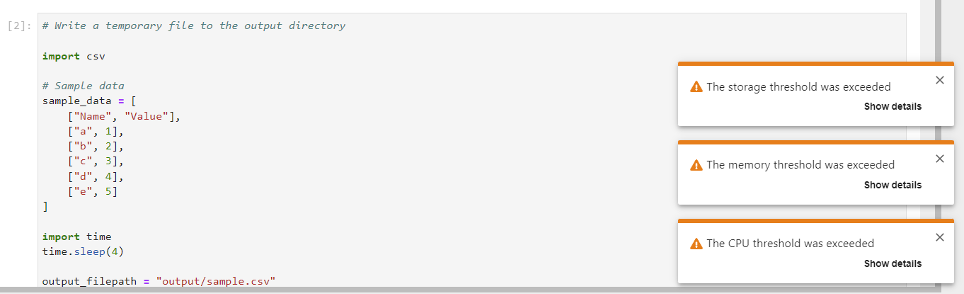
Figure 10 – Example of resources usage warning messages
Click on “Show details” to have more information about warning and related support documentation (Figure 11), or click on “x” to close message window.
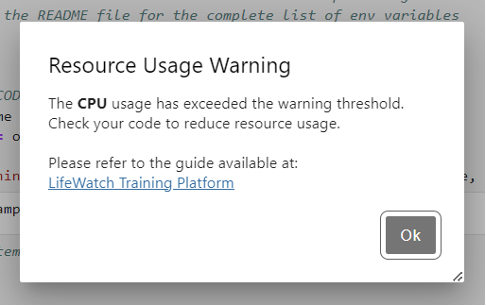
Figure 11 – Example of resource usage warning message - details