7. Execution details
Aggregazione dei criteri
7.6 Statistics
To view this section, you need to:
1. click on the appropriate service record within the List of Services
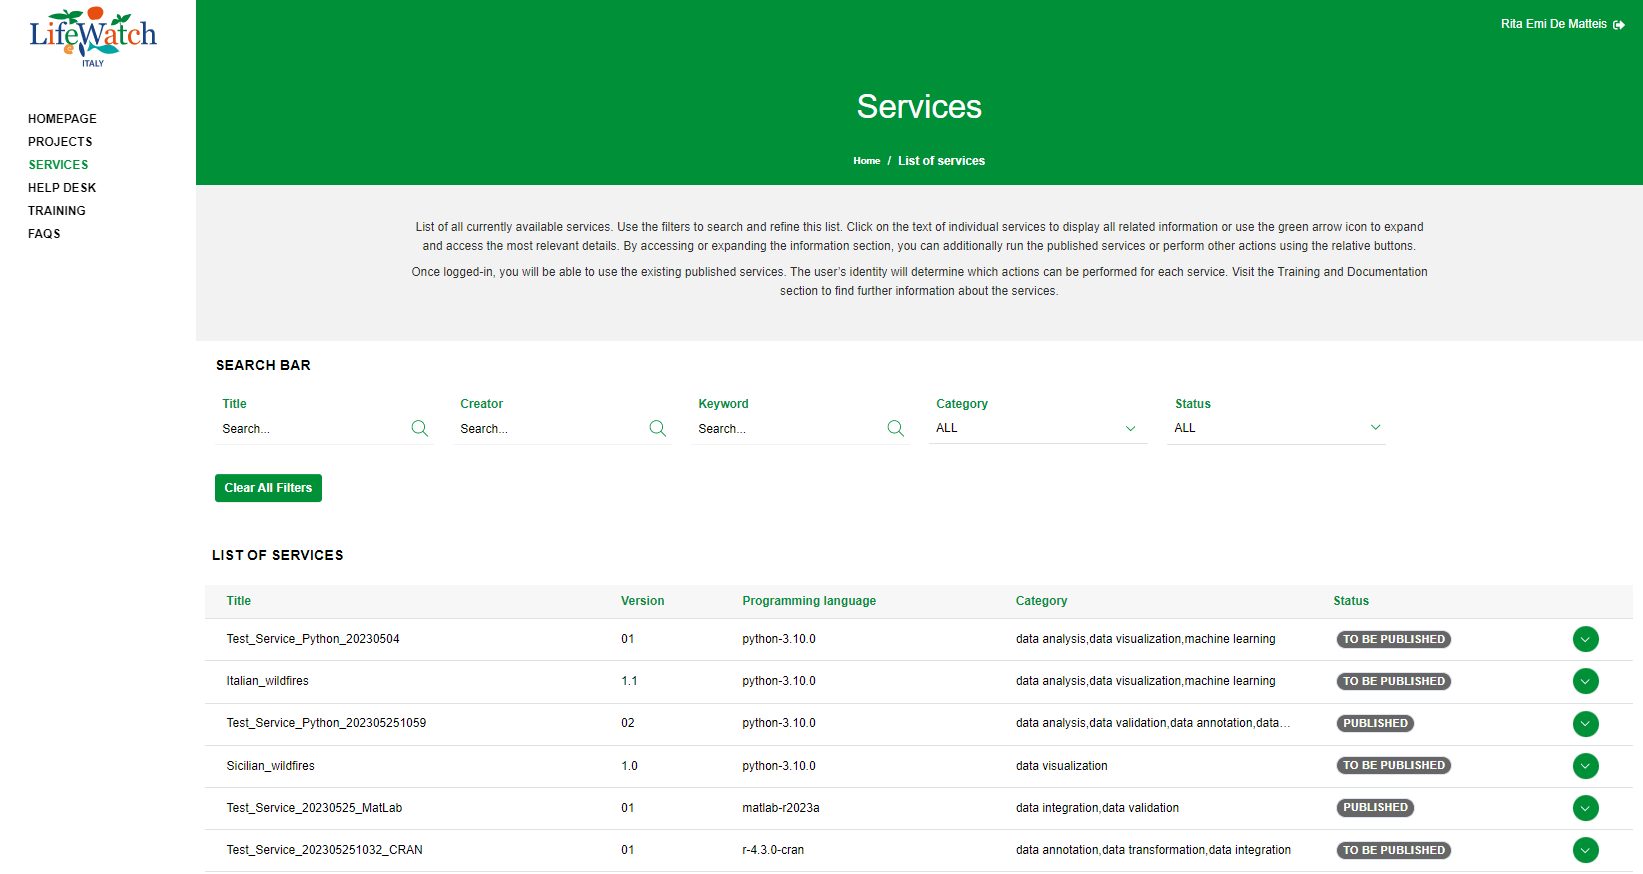
2. click on the Collapse icon to open the Execution accordion and click on the appropriate execution record
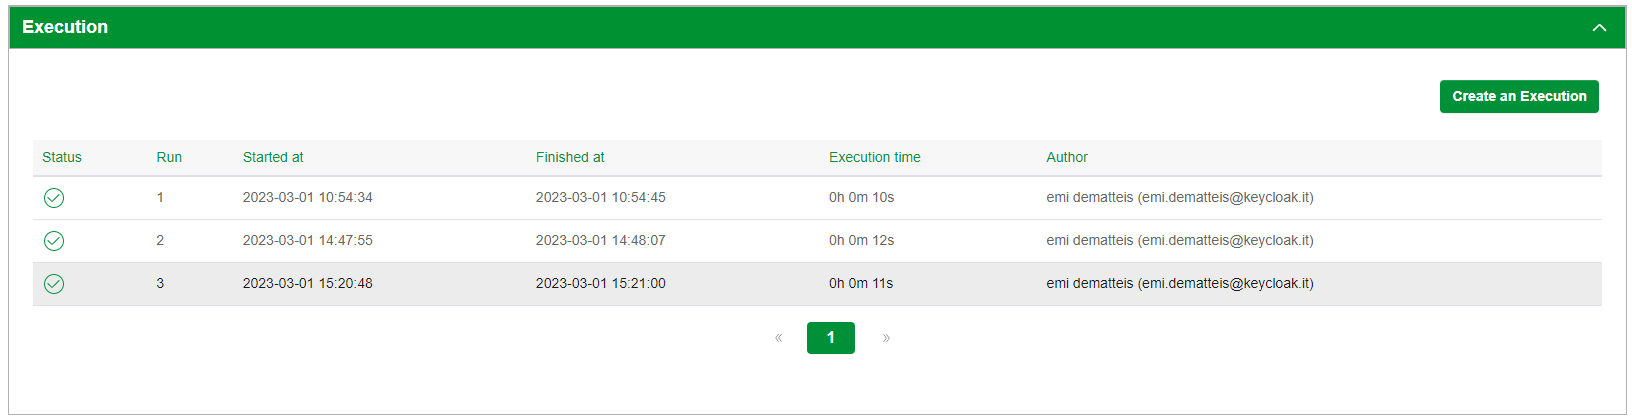
3. click on the Statistics accordion to see the information
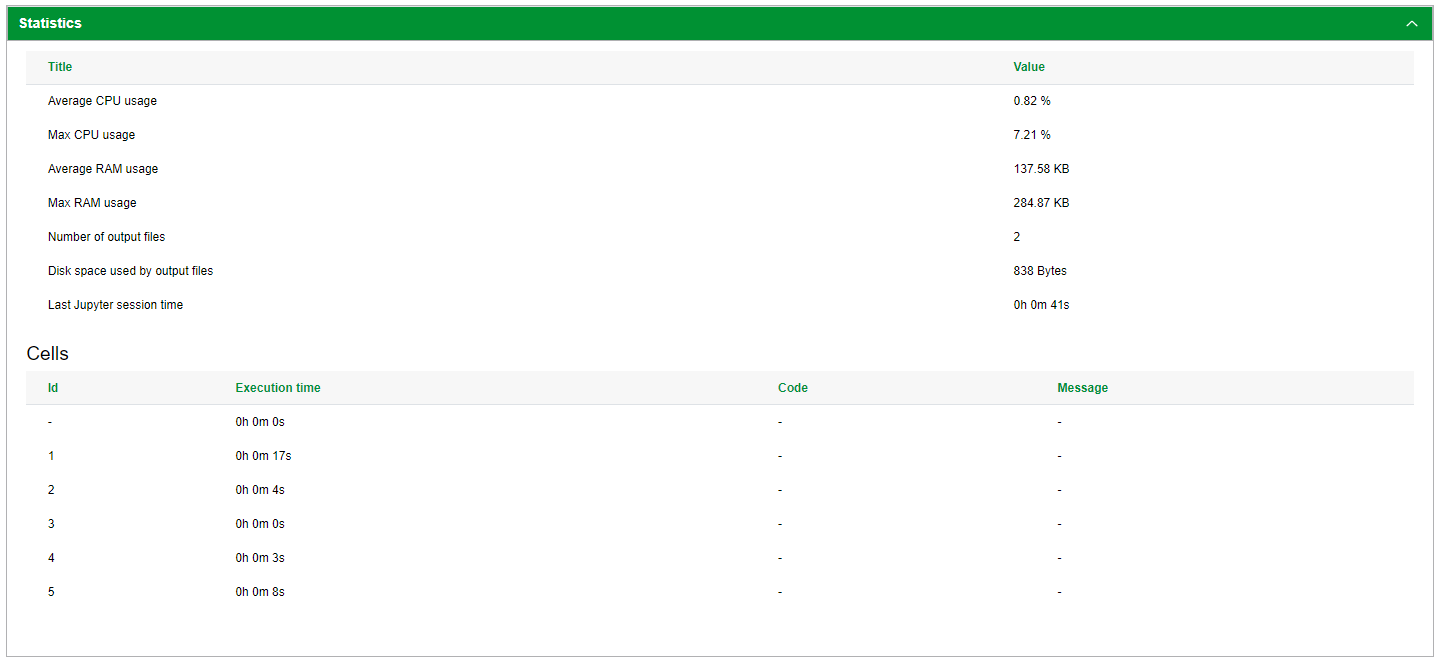
This section consists of two table:
- the first contains the statistics of the execution, that are:
- Average CPU usage
- Max CPU usage
- Average RAM usage
- Max RAM usage
- Number of output file
- Disk space used by output files
- Last Jupyter session time
- the second contains the execution time of each executed cell with any error messages.